
Figure 2.
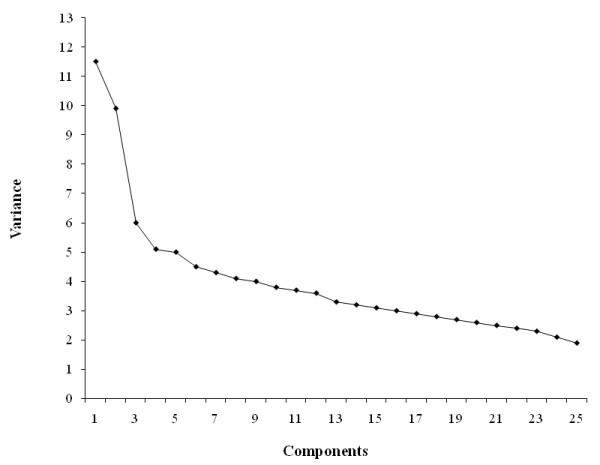
Factor (Principle component) analysis (n = 4009; weighted n = 99,249,927). Factor components are on the X axis and the corresponding variances are on the Y axis. Eigenvalues ≥ 1.5 and explained variance ≥ 6% were used in determining number factors to be retained. Factor, 1, 2, and 3 explained ≈11.5%, ≈10%, and ≈6%, respectively, variance in food intake.