Figure 2.
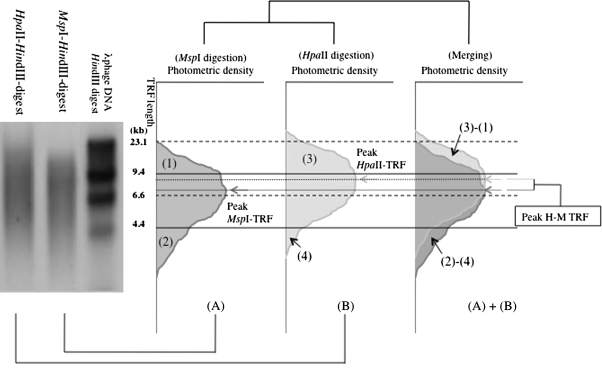
Peak-MspI-TRF and HpaII–MspI subtracted (H-M) TRF distribution with aging. Closed diamonds, peak-MspI-TRF; open squares, H-M-TRF. (A, Whole population; B, Men; C, Women) H-M values are regarded as approximately the mean values of the methylated lengths of subtelomeric region. The MspI-TRF gradually decreased with aging, but the H-M values did not. Note that some H-M values are negative. TRF = terminal restriction fragment.

