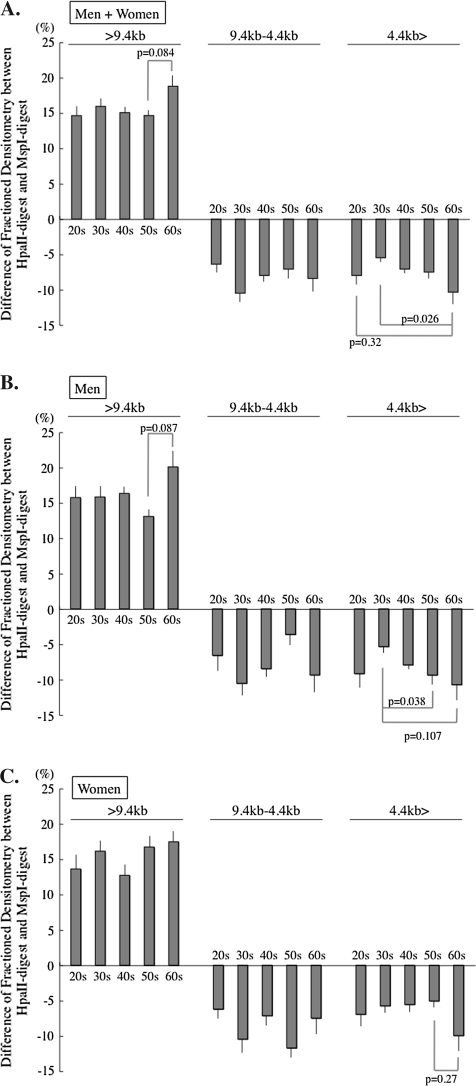
Figure 5.
H-M-TRF length distribution with aging. Subtracted value of the MspI-TRF from the HpaII-TRF densitometry in the three subdivided parts are shown as columns. (A, Whole population; B, Men; C, Women) The individuals in their 60s apparently have methylated telomeres both in long and in short telomeres. Horizontal bars depict the standard errors. TRF = terminal restriction fragment.

