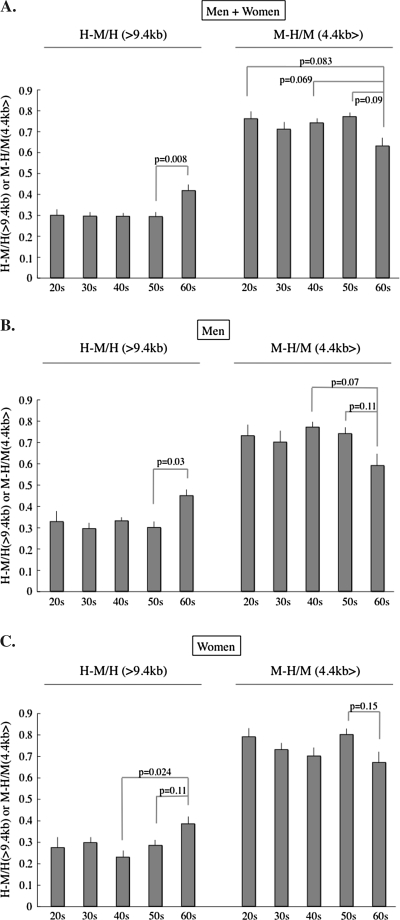
Figure 6.
Change of the relative methylation status of subtelomere with aging. The H-M area/HpaII area of >9.4 kb portion and the M-H area/MspI area of the 4.4 kb>, portion are used as indices indicating the subtelomeric methylation of longer and shorter (than 4.4 kb) telomeres, respectively. (A, Whole population; B, Men; C, Women). In participants in their 60s, the longer (>9.4 kb) telomeres contain more methylated subtelomeres and the shorter telomere (<4.4 kb) contains less methylated subtelomeres. This pattern is opposite to the pattern of the MspI columns >9.4 and <4.4 kb in the participants in their 60s in Figure 1. Horizontal bars depict the standard errors.

