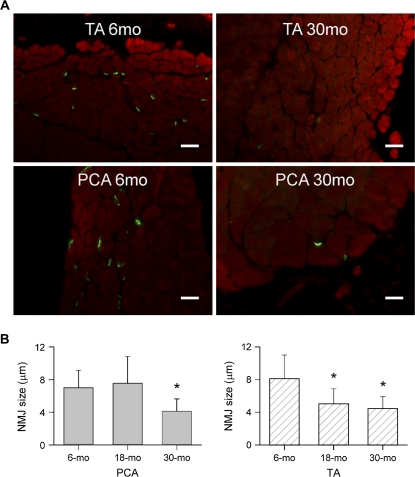
Figure 1.
Age-related loss of NMJ density and size. (A) Representative fluorescence microscopy images of NMJs from PCA and TA muscle sections from different animals labeled with α-bungarotoxin and phalloidin showing that NMJ number decreased from 6 to 30 months. TA, top panel; PCA, bottom panel (scale bars = 25 μm). (B) Mean NMJ size and standard deviations (μm). NMJs are significantly smaller at 30 months in PCA muscles than at 6 months (left). In TA muscles, NMJs are significantly smaller at 18 and 30 months compared with 6 months (right). *p < .05 vs 6 months. NMJ = neuromuscular junction; PCA = posterior cricoarytenoid; TA = thyroarytenoid.

