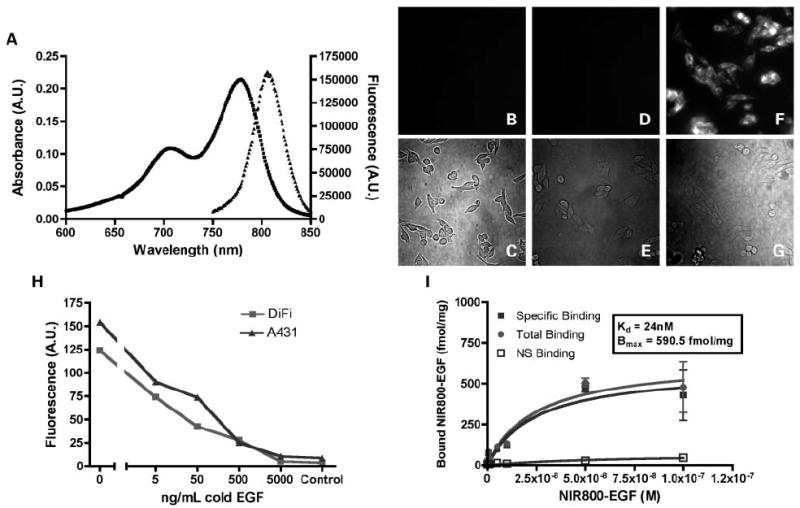
Fig. 2.

Spectroscopy, specificity, and intracellular visualization of the NIR800-EGF imaging agent. A, absorbance (■) and fluorescence (▲) emission of 1 μmol/L aqueous solution. B to G, live DiFi cells labeled with NIR800-EGF and imaged by fluorescence microscopy. B and C, no appreciable autofluorescence was observed in unlabeled DiFi cells (blank). D and E, DiFi cells pretreated with unlabeled (“cold”) EGF followed by NIR800-EGF were nonfluorescent, indicating EGFR specificity. F and G, plasma membrane of DiFi cells incubated with the agent was brightly fluorescent, suggesting localized binding at the cell surface. H, in vitro competitive displacement assay in DiFi and A431cells. I, saturation binding isotherms for NIR800-EGF in DiFi cells (Kd = 24 nmol/L, Bmax = 591fmol/mg).
