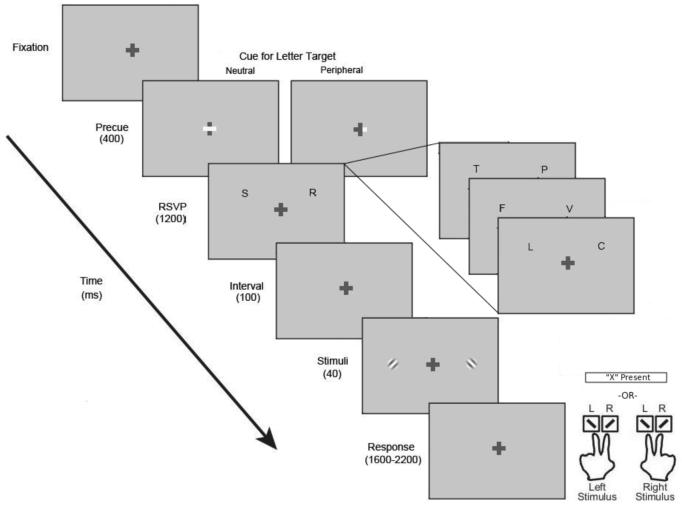
Figure 1.
Schematic depiction of the trial sequence in the main and control condition. For ease of illustration, the cues are depicted as a brightening of the horizontal arm of the fixation cross, whereas in the actual experiments, they were presented as a thickening of the horizontal arm. Also for illustrative purposes, the tilt of the Gabors is exaggerated.

