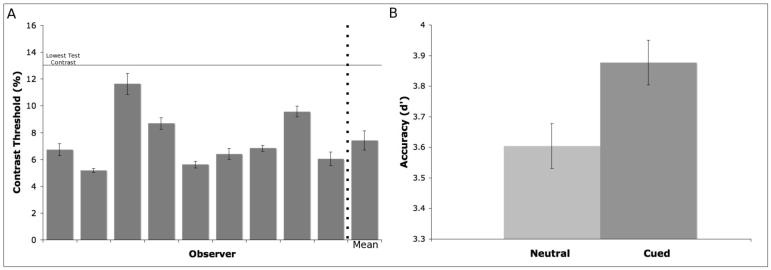
Figure 2.
(A) Detection thresholds for individual observers and group average (last column). Error bars are s.e.m. across six measurements for individual thresholds, and across 9 observers for the average threshold. (B) RSVP performance in d' units combined for the main and control condition. Error bars are within-subject standard errors calculated using the method of (Loftus & Masson, 1994).

