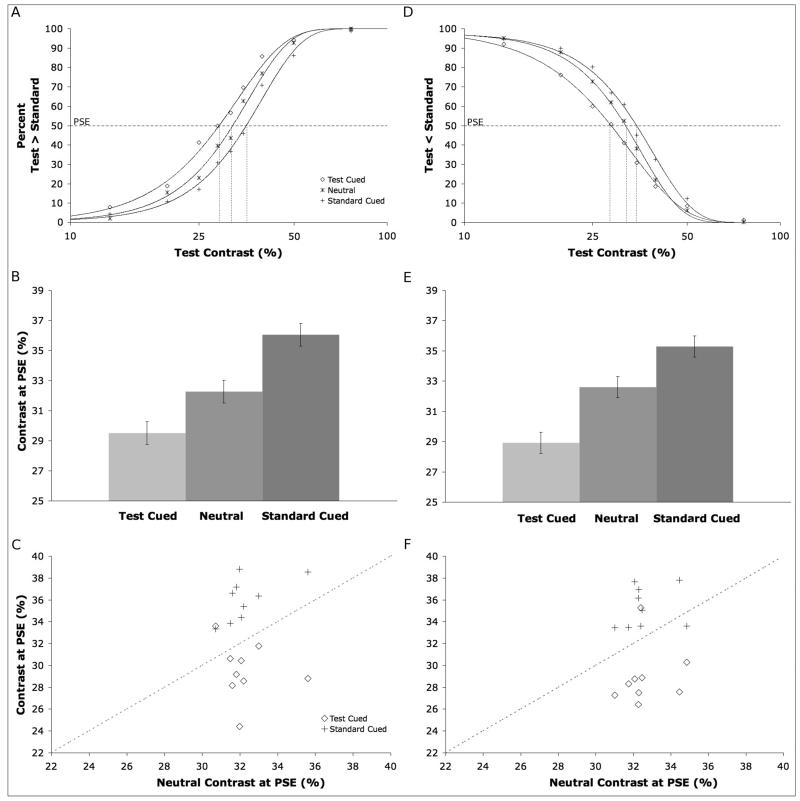
Figure 3.
(A) Appearance psychometric functions for the main condition, plotting the proportion of trials on which observers chose the test stimulus to be of higher contrast as a function of its physical contrast. (B) Point of subject equality (PSE) values for the three cue types in the main condition. Error bars are s.e.m. calculated as in Fig. 2B. (C) Scatter plots of individual observer's PSEs, plotting the test cued PSE (circles) and standard cued PSE (cross) against the neutral PSE. (D-F) Same data for the control condition.

