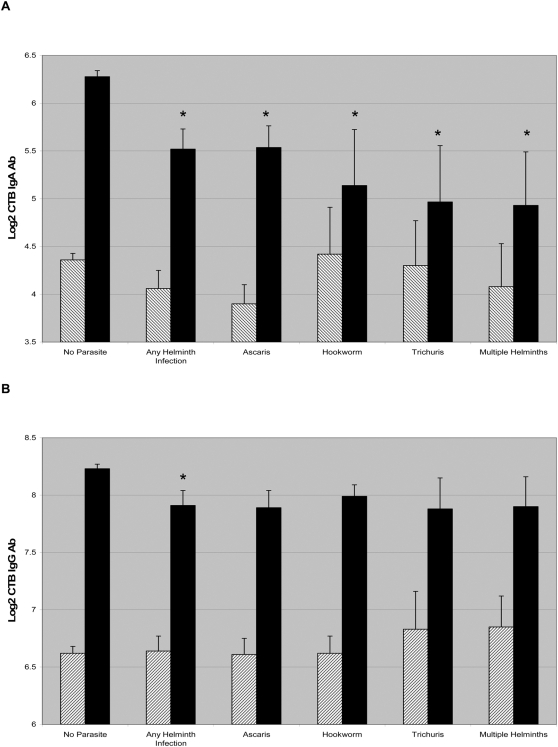
Figure 1. CTB specific IgA and IgG responses are shown in cholera patients across classes of helminth infection (A and B, respectively).
The hatched bars indicate the mean log2 transformed CTB titer on day 2, and the dark bars indicate the titer on day 21 and error bars indicate the standard error of the mean. An asterisk denotes a statistically significant difference between non-infected and infected individuals. All classes of helminth infected patients had significantly lower CTB IgA immune responses on day 21 compared to non-helminth infected controls.

