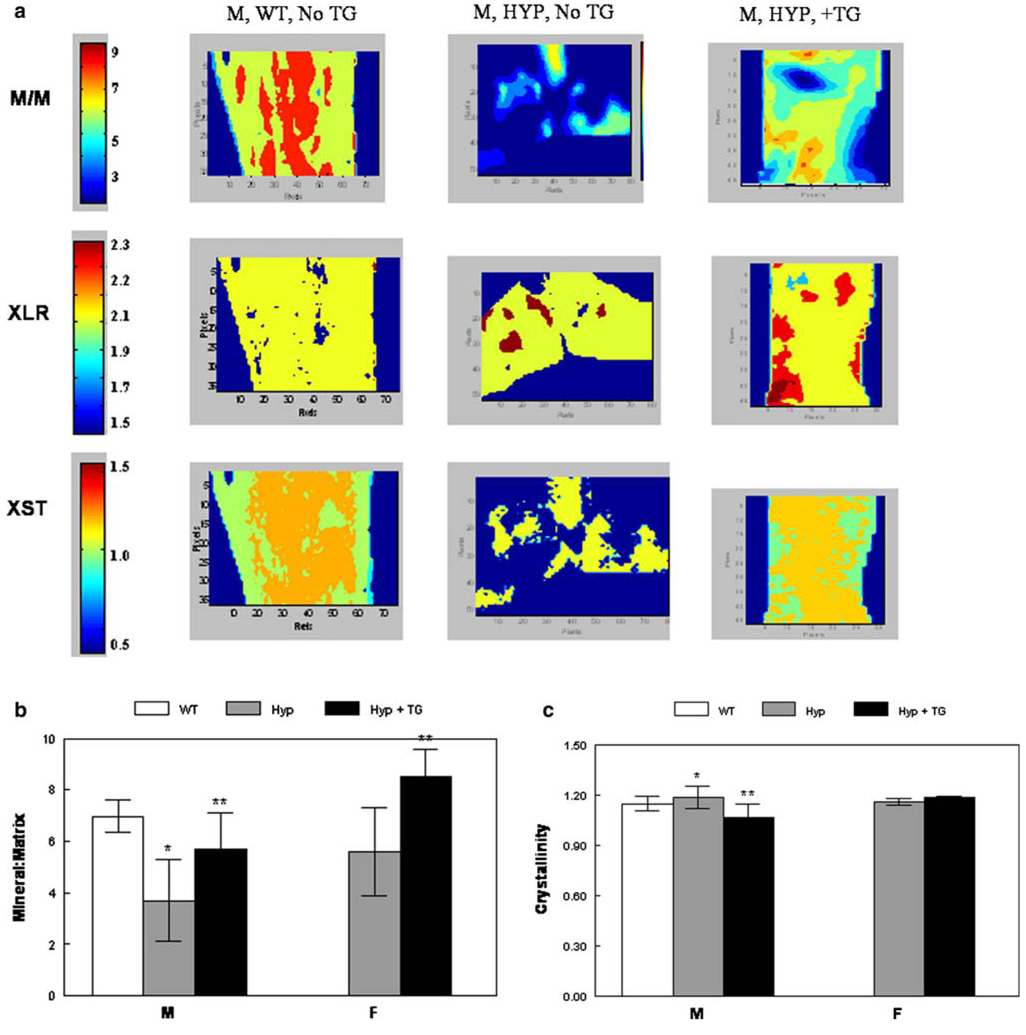
Fig. 7.
Infrared imaging spectroscopy. a Typical images showing the distribution of mineral parameters in male HYP, WT, and HYP + TG and female HYP and HYP + TG humerii. Mean and SD for multiple images are summarized for b mineral/matrix and c crystallinity. *p < 0.01 relative to WT; **p < 0.01 relative to same genotype without the transgene

