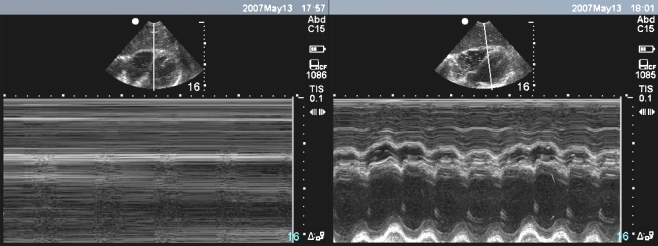
Fig. 1.
Bedside cardiac sonography of the heart during ACLS. The subxiphoid cardiac view demonstrates a B-mode view of the heart (top of screen) and M-mode view through the heart (bottom of screen). In the left panel, M-mode demonstrates a lack of cardiac activity or “sonographic asystole.” Four minutes later, the cardiac activity is evident (right panel)

