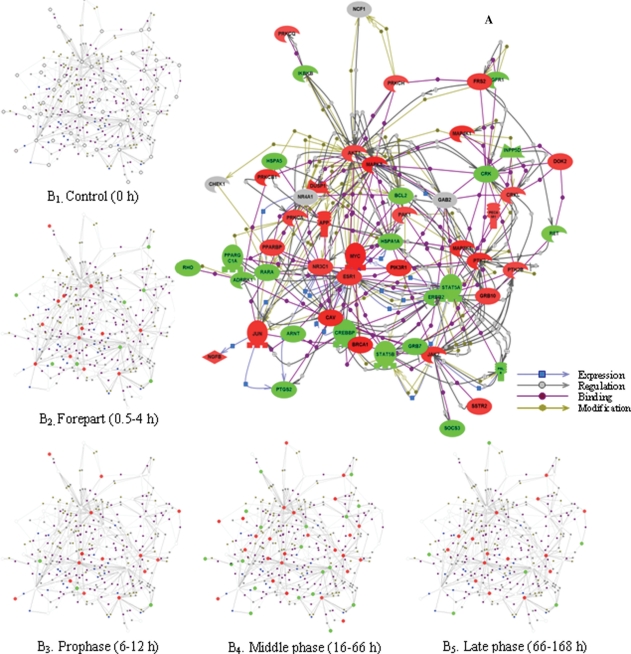
Figure 3.
Expression dynamics and interaction of 54 intracellular signaling cascade-associated genes during rat liver regeneration (LR). The interactions of intracellular signaling cascade-associated genes were assayed by pathway studio 5.0 software. Red, green, gray and white shapes denote the up-regulated, the down-regulated, the up/down-regulated and the meaninglessly expressed genes, respectively. A. The interactions of 54 genes with closer relationships. B. Expression changes at each phase during LR.

