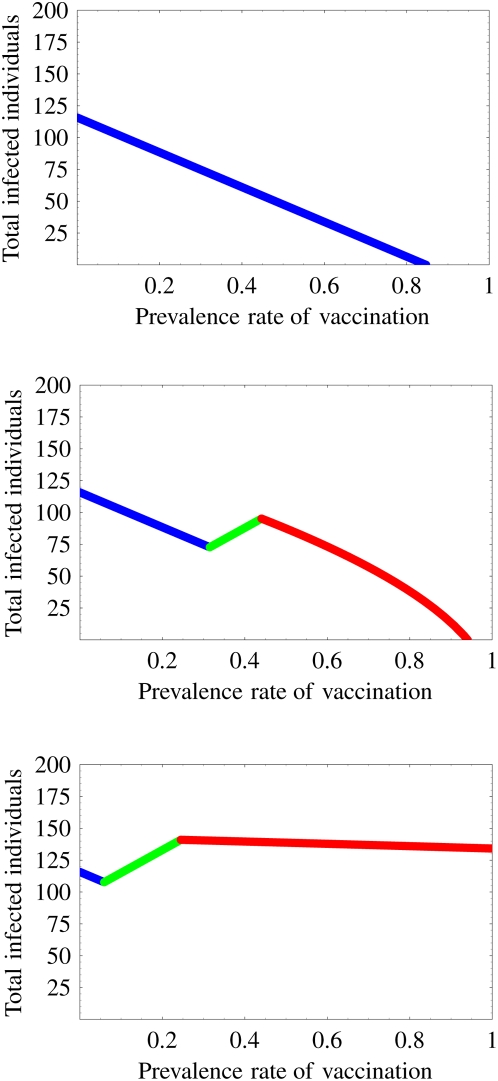
Figure 3. Impact of the loss of the protection effectiveness of the vaccination on the change of the final size of the epidemic: The losses of the protection in the top, middle, and bottom figure are σ = 0.05, 0.15, and 0.8, respectively.
The top (0≤σ≤σ
*) and middle ( ) figures portray the possibility of eradication of the infectious disease through the vaccination program. However, in the bottom figure (
 ), the vaccination engenders a failure to prevent the spread of the disease. The patterns of the change are divisible into these three cases, depending on the loss of the protection. The blue, green, and red lines respectively correspond to the situation in which only the vaccine-sensitive strain exists, both the vaccine-sensitive and the vaccine-resistant strains exist, and only the vaccine-resistant strain exists.

