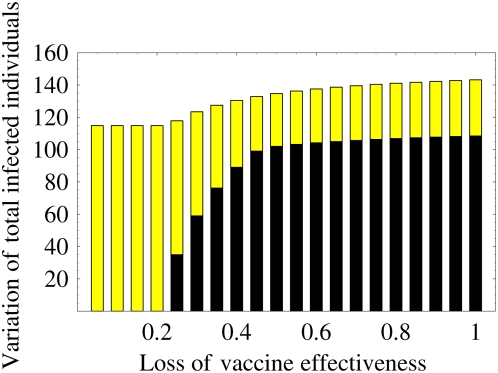
Figure 5. Variation of the final size of the epidemic over the vaccination prevalence: The black bar represents the optimal (smallest) final size of the epidemic.
The yellow bar represents the worst (largest) final size of the epidemic over the vaccination prevalence. The variation of the final size depending on the prevalence rate is between black and yellow bars. If the loss of protection effectiveness is small, then the variation is very large. On the other hand, if the loss becomes large, then the variation decreases. Therefore, the final size of the epidemic is strongly affected by the vaccination coverage and the loss of protection effectiveness: a bad vaccination program (far from the optimal prevalence rate) increases the final size and prevents eradication of the disease.

