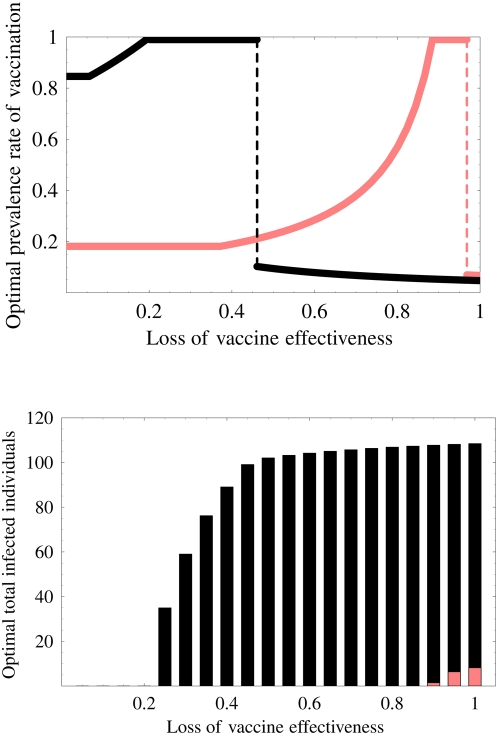
Figure 6. Effects of non-pharmaceutical intervention: The top figure shows the optimal prevalence rate of the vaccination program with (pink curve) or without (black curve) non-pharmaceutical intervention.
The non-pharmaceutical intervention readily achieves the optimal prevalence rate and hinders the catastrophic change. The bottom figure shows the optimal final size of the epidemic with (pink bar) or without (black bar) the non-pharmaceutical intervention. The intervention also dramatically reduces the final size of the epidemic.

