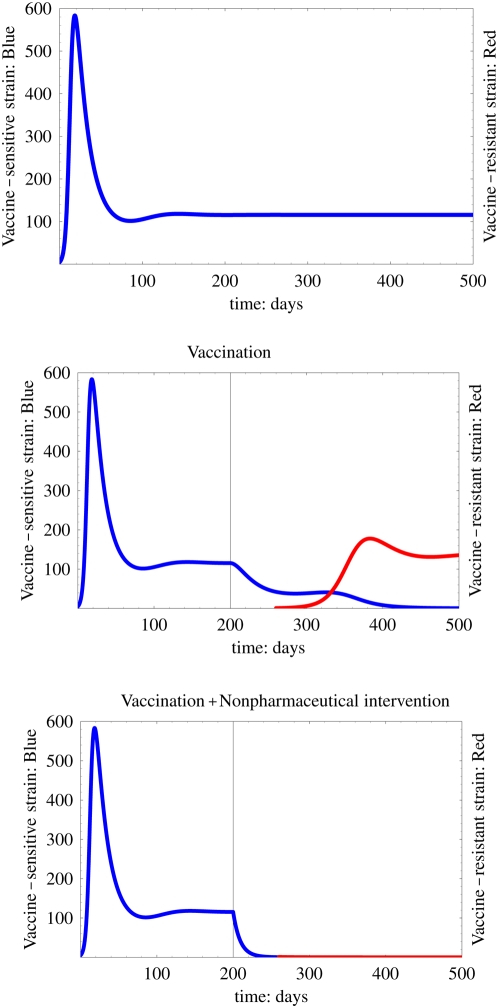
Figure 7. Time-course of the spread of the disease with vaccination and non-pharmaceutical interventions: We calculate epidemic curves with a vaccination program for 500 days.
The vaccination program and non-pharmaceutical intervention are started after the vaccine-sensitive strain becomes endemic (around 200 days). We assume that the vaccine-resistant strain occurs after the start of vaccination (around 260 days). The top, middle, and bottom figures respectively depict time courses of infection without the vaccination program, with only the vaccination program, and with both the vaccination program and the non-pharmaceutical intervention. The blue and red curves respectively represent the number of infected individuals with vaccine-sensitive and vaccine-resistant strains. We assume that the prevalence rate of vaccination program is p = 0.5, the loss of protection effectiveness is σ = 0.8.

