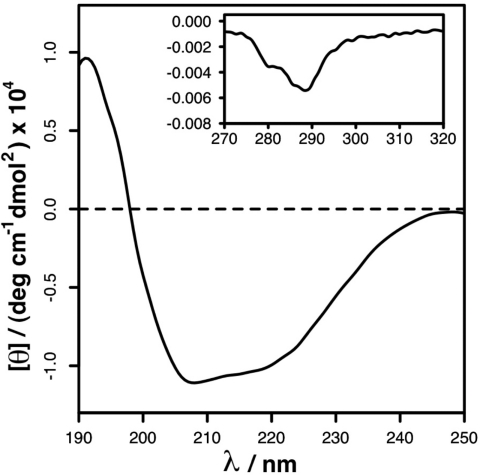
Fig. 3.
CD spectrum of RSV M. Datasets of the far-UV (main box, 190–250 nm) and near- UV (inset box, 270–320 nm, axes are the same as the main plot) spectra were collected as indicated in Experimental Procedures. The data were analyzed for secondary structure information by using the CDSSTR, SELCON3, and CONTIN/LL programs. A more comprehensive dataset on M254R structure in solution is provided in Fig. S3, Fig. S4, Table S2, and Table S3; also, see Table 1. A comparison with X-ray data with calculated CD spectra indicates that the crystal is more ordered than the solution structure.

