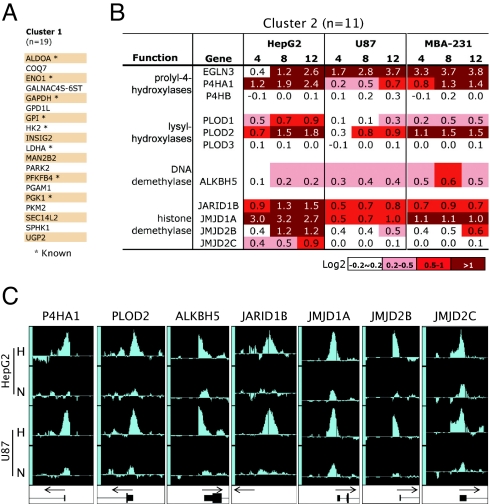
Fig. 3.
Overrepresentation of 2-OG-dioxygenases among HIF-1 ChIP hits. (A) HIF-1 target genes in Cluster 1, with previously described HIF-1-bound targets indicated with an asterisk. (B) HIF-1-targeted 2-OG-dioxygenases in Cluster 2. Average change (Log2) in mRNA expression levels at 4, 8, and 12 h of hypoxia in HepG2, U87 and MDA-MB231 cells are indicated by using the assigned color scale. (C) Representative IGB tracks showing HIF-1 binding at promoter regions of the 2-OG-dioxygenase family genes in HepG2 and U87 cell lines. For each locus, tracks are scaled identically between hypoxia (H) and normoxia (N) samples.

