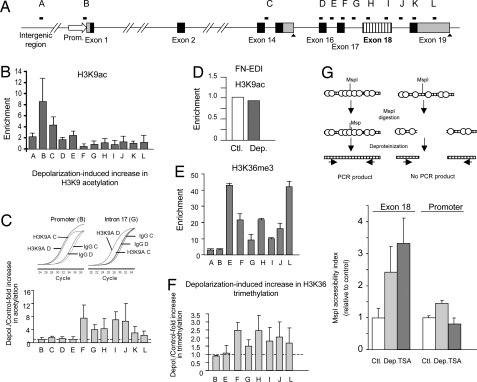
Fig. 4.
Depolarization triggers local changes in histone modifications and chromatin structure assessed by nChIP. (A) Scheme of the ncam gene showing the distribution of qPCR amplicons. (B) Levels of H3K9 acetylation at the regions indicated in A, corresponding to untreated N2a cells. (C) Increase of H3K9 acetylation in the same regions in response to depolarization with 60 mM KCl for 4 to 6 h. Inset, qPCR amplification curves from control (C) and depolarized (D) samples corresponding to a non-responding region (i.e., promoter) and a region that shows increased acetylation levels after depolarization (i.e., intron 17) (D) Negative control showing no changes in H3K9 acetylation on the FN gene at the EDI alternative exon. Means and SD correspond to 2 or 3 independent experiments. (E) Representative levels of H3K36 tri-methylation at the regions indicated in A, corresponding to untreated N2a cells. (F) Increase of H3K36 tri-methylation in the same regions in response to depolarization with 60 mM KCl for 6 h. Means and SD correspond to 2 independent immunoprecipitations of 1 experiment. (G) Scheme of the MspI accessibility assay used (Upper) and bar graph depicting the changes in chromatin accessibility (Lower). Cells were treated for 5 h with 60 mM KCl (Dep) or 1 μM TSA or left untreated (Ctl). The accessibility index was evaluated (see Materials and Methods) for the NCAM exon 18 region and a promoter region. Results are expressed relative to value obtained in each amplicon for the control cells.

