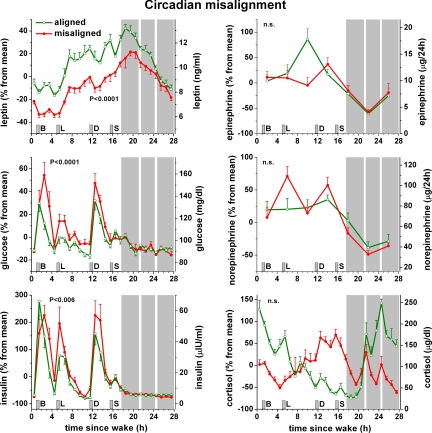
Fig. 4.
Consequences of circadian misalignment on metabolic, autonomic, and endocrine function. Data are plotted according to time-since-wake, during normal circadian alignment (open green symbols; scheduled awakening at habitual wake time) and during circadian misalignment (filled red symbols; scheduled awakening 12 h out of phase from habitual wake time). P-values, statistical significance for effect of misalignment [based on 24-h cycle for variable mainly driven by circadian cycle (cortisol) and 28-h cycle for variables mainly driven by behavioral cycle (others)]; gray area, scheduled sleep episode; short vertical gray bars, meal times as in Fig. 1.

