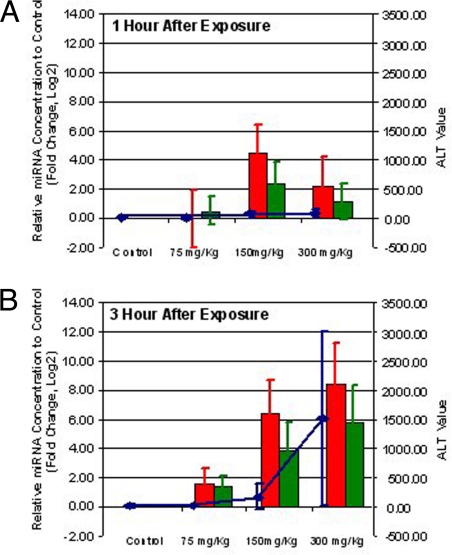
Fig. 2.
MicroRNAs are more sensitive markers than ALT for liver injury. The comparison among the levels of mir-122 (red bars), mir-192 (green bars), and ALT (blue line) in plasma samples collected from mice at 1 (A) and 3 (B) h after exposure to different doses of acetaminophen (indicated on x axis). The relative change of miRNA expression levels (ratio in log 2 compared with control) is indicated on the left side of the figure and the scale of ALT level is on the right. The relative change of miRNA levels is expressed in log 2 ratio of each treatment condition compared with the corresponding control. The values of miRNA fold change and ALT levels are the average of 4 independent samples from each time point, and the standard derivations are shown as error bars.

