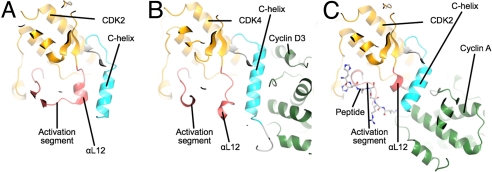
Fig. 2.
Comparison of the structures of monomeric CDK2, CDK4/cyclin D3, and T160pCDK2/cyclin A. The 3 structures are viewed looking down onto the CDK C-terminal domain from the N-terminal domain and are colored according to the scheme used in Fig. 1. (A) Monomeric CDK2. (B) CDK4/cyclin D3. (C) T160pCDK2/cyclin A. The figure highlights the displacement of the CDK4/cyclin D3 activation segment away from the active conformation present in T160pCDK2/cyclin A and its similarity to the structure of the activation segment in monomeric CDK2 (monomeric T160pCDK2 PDB ID code 1HCK).

