Fig. 1.
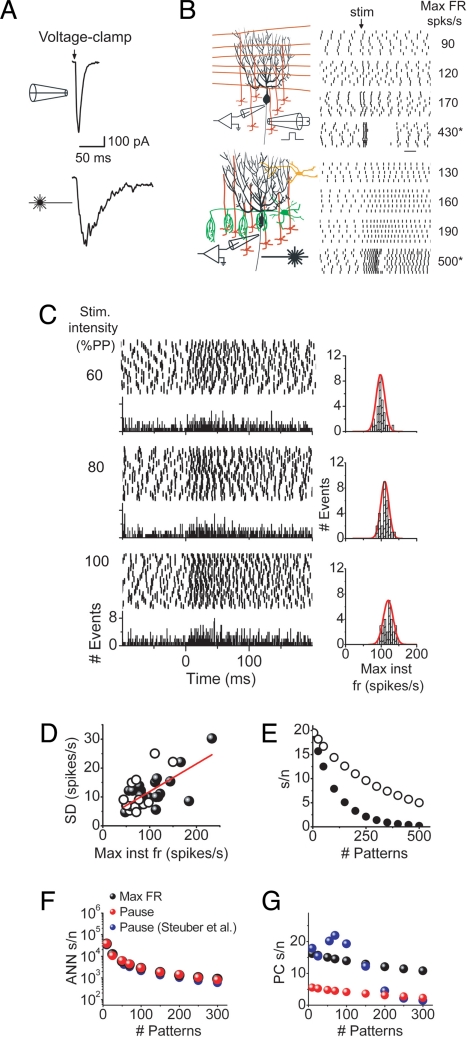
Pattern recognition capacity of Purkinje cells using the linear computational algorithm. The reproducibility with which Purkinje cells encode the strength of the same parallel fiber input in their maximum firing rate was determined by repeatedly stimulating the same patch of granule cells and measuring the maximum instantaneous firing rate after stimulus. Granule cells were activated synchronously by electrical stimulation or asynchronously by photoreleasing glutamate by using a 1-ms pulse of UV light. (A) In contrast to the fast kinetics of Purkinje cell EPSCs obtained from synchronous activation of granule cells by electrical stimulation, photorelease of glutamate activated granule cells asynchronously and resulted in corresponding EPSCs that had a slow time course and noisy appearance. (B) Raster plots showing that increasing the strength of stimulation resulted in correspondingly higher maximum firing rate responses with either synchronous or asynchronous activation of parallel fiber inputs. Vertical bars indicate the time of occurrence of each action potential. Strong stimulation intensities produced responses that consisted of an initial high frequency burst, followed by a pause (asterisks), although with asynchronous activation of inputs, it was not always possible to generate a burst–pause response. (C) Raster plots of the response of a Purkinje cell to 50 repeated presentations of the same asynchronous stimulus. Granule cells were stimulated every 30 s, and the intensity of the UV photolysis light was adjusted to 1 of 3 different strengths that were chosen to be below that which resulted in a burst–pause response. Below each raster plot, the associated population histogram is shown. The histograms to the right of each raster plot show the resulting maximum instantaneous firing rate distribution after stimulus. Each distribution was fit well by a Gaussian function (red line). (D) The scatter plot of the standard deviations of the maximum firing rates after stimulus determined from a number of experiments similar to that described above. Open symbols correspond to standard deviations obtained when latterly positioned patches of granule cells were activated, whereas the filled symbols correspond to activation of patches of granule cells immediately underneath the target Purkinje cell. (E) The experimentally determined standard deviations were implemented in an artificial neural network to estimate the s/n of Purkinje cells by using the linear computational algorithm in distinguishing learned patterns from novel ones. The s/n decreased as the number of patterns that had to be learned increased. Filled circles correspond to estimates where it was assumed that each parallel fiber synapse releases neurotransmitter only once. The open circles correspond to estimates for which paired pulse facilitation at the parallel fiber to Purkinje cell synapse was taken into consideration. (F) The pattern recognition capacities of 3 different ANNs were compared for synchronous parallel fiber inputs and with synaptic inhibition blocked. Black symbols corresponds to the ANN described in the present study assuming that Purkinje cells encode information in their maximum firing rate. Red symbols reflect the performance of the same ANN when it was assumed that Purkinje cells encode information in pauses. Blue symbols represent the performance of the ANN implemented by Steuber et al. (3) that also used pauses to encode input patterns. (G) Comparison of the pattern recognition capacity of a Purkinje cell based on the ANNs described in F. Blue symbols are taken from Steuber et al. (3). Black and red symbols correspond to present study assuming that Purkinje cells encode information in their maximum firing rate (black symbols) or in pauses (red symbols).

