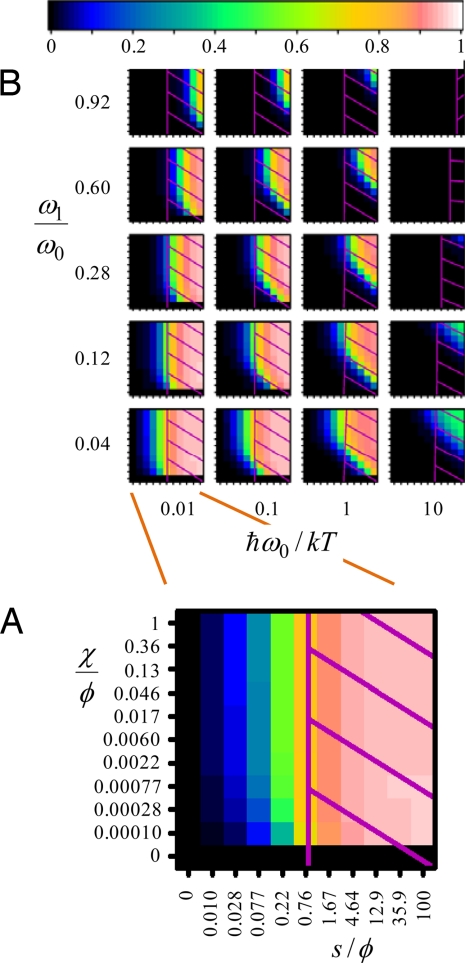
Fig. 2.
Regions in which strong Fröhlich condensates can be observed. For linear dispersion and Z = 25 modes, the condensation index η is colored in plots as a function of the ratio of the energy input to the bath relaxation, s/φ, and the ratio of the rate of energy redistribution to bath relaxation, χ/φ. (A) single plot at a band-Center vibration frequency to temperature ratio of ℏω0/kT = 0.1 and band-narrowness parameter ω1/ω0 = 0.04 extracted from B. (B) All results. Superimposed on each plot is a hatched region indicating system temperature TS/T > 5/3 (500 K if the bath temperature is T = 300 K); such regions are certainly not accessible in a biological environment.

