FIGURE 2.
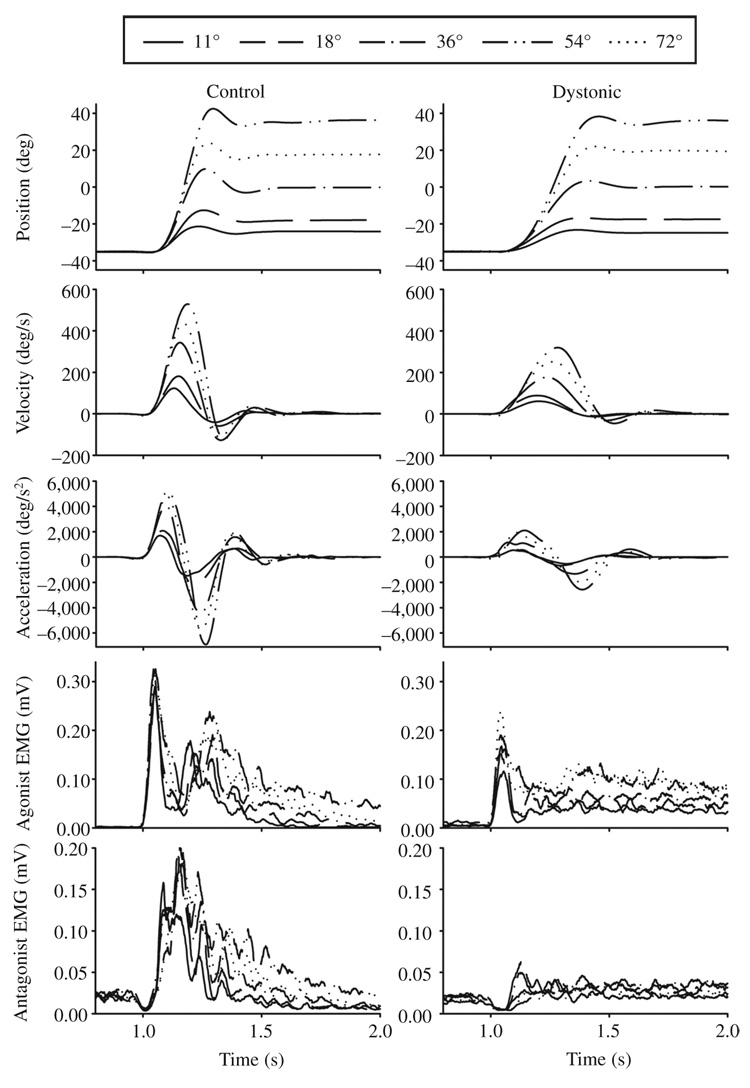
FIGURE 2A. Wrist flexion movements from 11 to 72°. Average angle, velocity, acceleration, agonist electromyogram (EMG), and antagonist EMG signals are shown across 5 distances in two dystonic and two matched control participants. The two dystonic participants are participants D12 (2A) and D16 (2B). The arrow in the agonist EMG panel of the dystonic individual with FHD in B identifies the small first agonist burst in this individual.
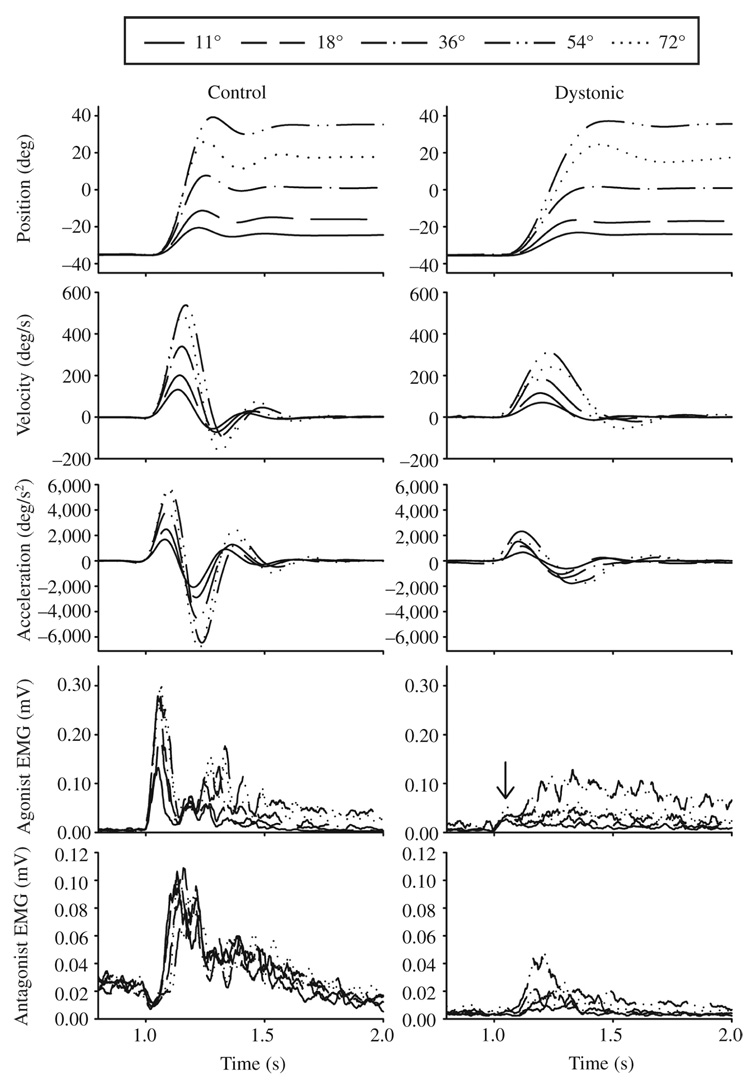
FIGURE 2B. Wrist flexion movements from 11 to 72°. Average angle, velocity, acceleration, agonist electromyogram (EMG), and antagonist EMG signals are shown across 5 distances in two dystonic and two matched control participants. The two dystonic participants are participants D12 (2A) and D16 (2B). The arrow in the agonist EMG panel of the dystonic individual with FHD in B identifies the small first agonist burst in this individual.


