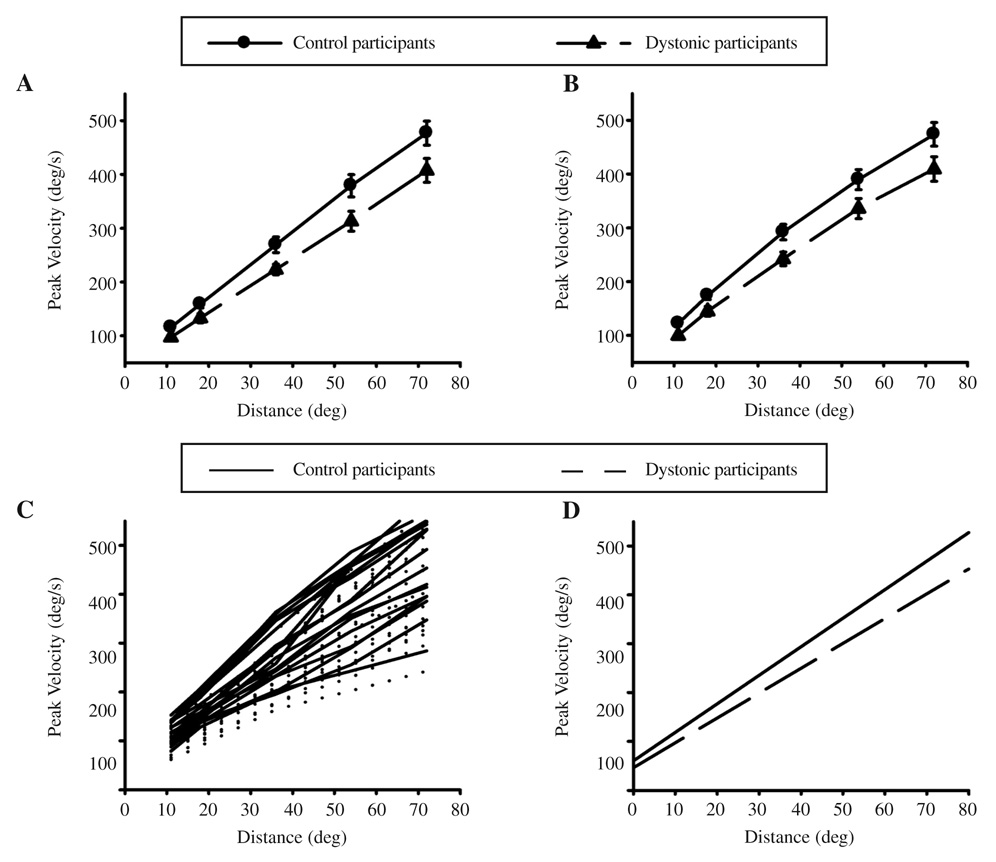
FIGURE 3.
Mean and standard error of peak velocity across 5 distances at the (A) wrist and (B) elbow for control and dystonic participants. C is the average peak velocity across joint for each distance for individual controls and dystonics. D shows the linear regression lines for the data in C (extended to show the intercept).

