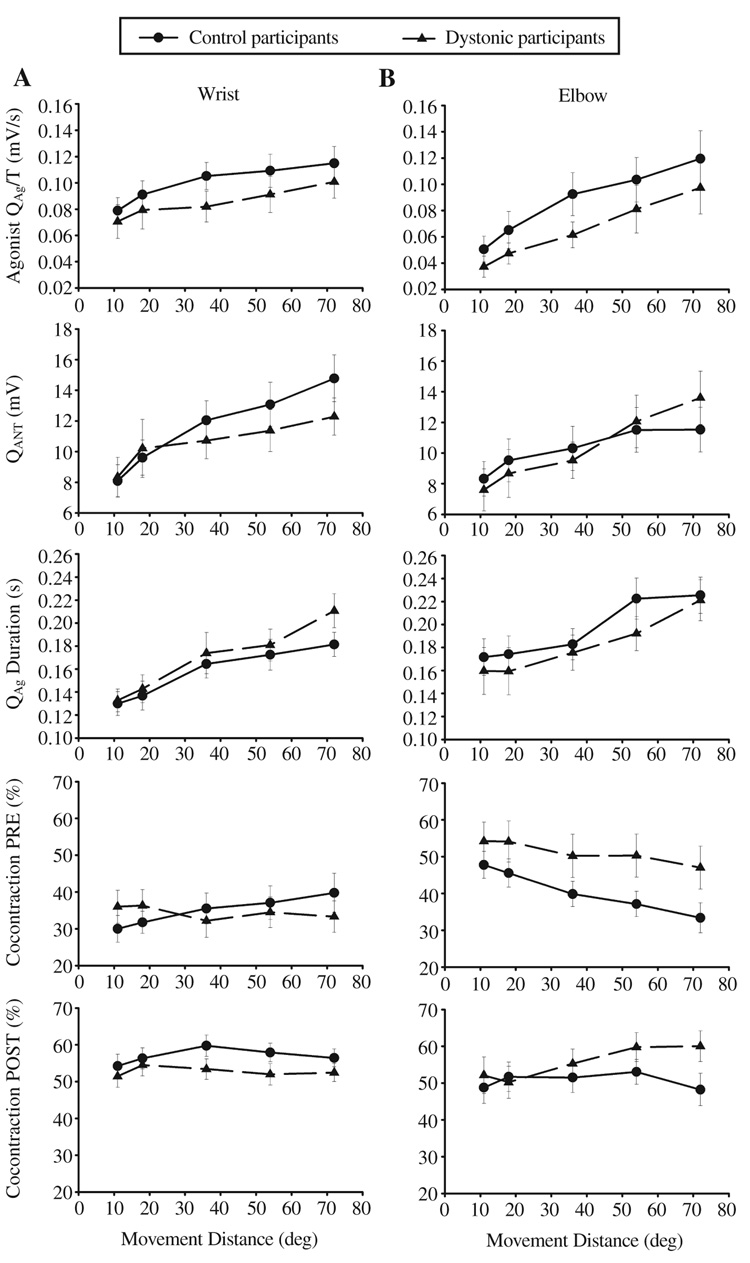
FIGURE 4.
From top to bottom: mean and standard error of the integral of the agonist electromyogram (EMG) divided by time, integral of the antagonist, duration of the first agonist burst, cocontraction from movement onset up to peak acceleration (PRE), and cocontraction from peak acceleration up to peak velocity (POST) across 5 distances at the (A) wrist and (B) elbow joints for control and dystonic participants.

