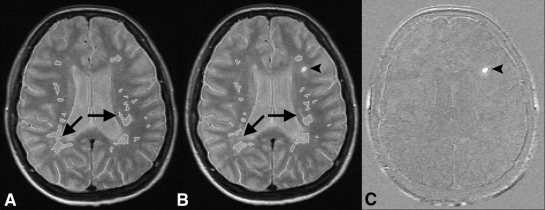
Figure 2:
MR images show example of variability in lesion outlines for lesion load measurements on native images. A, Native baseline PD-weighted image (2000–3000/60–100). B, Native follow-up PD-weighted image. C, Subtraction image. Lesions do not change (except for one new lesion), but lesion outlines (of stable lesions) do show variability (arrows), which decreases precision and, subsequently, power to detect treatment effects on native images. Subtraction images circumvent this problem, as only active lesions (arrowheads) are displayed, allowing direct quantification of change.

