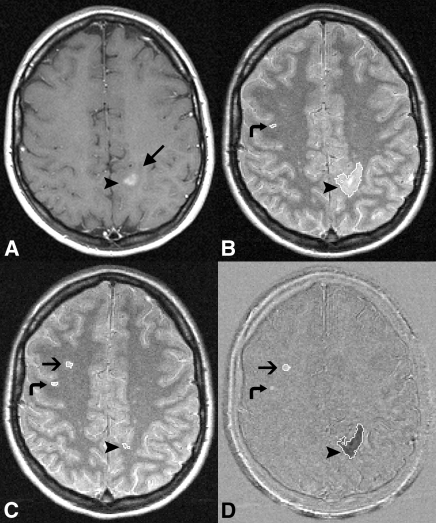
Figure 3:
MR images show a large lesion load of negative activity relative to positive activity, possibly confounding detection of treatment effect. A, Native baseline gadolinium-enhanced T1-weighted image (400–700/5–25). B, Native baseline, C, native follow-up PD-weighted and, D, subtraction images with lesion outlines overlaid. Enhancing lesion (arrowheads) on A and B surrounded by edema (long arrow), which has been resorbed on C. Short arrows = new lesion on C and D. Curved arrows = false-positive positive activity on D, as the lesion was visible on B and C and did not increase in size.

