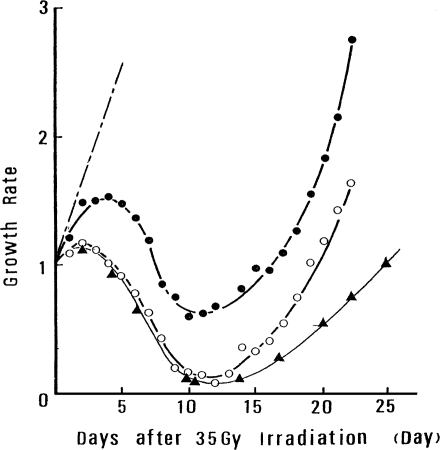
FIGURE 4.
Regrowth curve of tumors exposed to 35 Gy locally or to combined treatment (Miyamoto and Sakamoto, 1987): • tumors irradiated locally; ○, tumors irradiated locally, 12 h after TBI; ▴ tumors irradiated locally after five TBI treatments spaced 8 h apart; –·– nonirradiated control mice.

