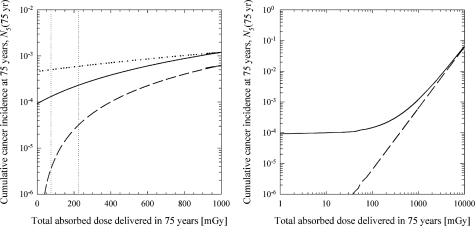
FIGURE 3.
Contribution to cumulative lung-cancer incidence of DNA damage formed by endogenous processes and ionizing radiation. Except where explicitly noted otherwise, calculations are based on the best-estimate parameters listed in Table 1. Protective effects are not included in this set of calculations (i.e., Af =Ag =1 and Bf = Bg =0). Solid line: DNA damage formed by ionizing radiation and endogenous processes; dashed line: endogenous processes do not create any DNA damage ( = =0); dotted line: DNA damage formed by ionizing radiation and endogenous processes with = 0.1/cell/year and adjusted values for Ωand φcl. Left panel: semi-log plot of cumulative incidence versus dose; right panel: log-log plot of cumulative incidence versus dose (expanded dose scale). The vertical dotted lines indicate the typical dose range expected from naturally occurring radiation sources (lower bound corresponds to 1 mGy/year and the upper bound corresponds to 3 mGy/year).

