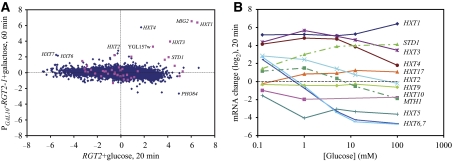
Figure 5.
The Rgt network regulates a small number of glucose-induced genes. (A) Microarray data presented as in Figure 1 for a PGAL10-RGT2-1 strain pregrown in SC+3% glycerol 60 min after galactose addition relative to 0 min (y-axis) versus a RGT2 strain 20 min after glucose addition relative to 0 min. Genes that showed essentially normal induction by glucose in a tpk1astpk2astpk3as sch9as strain in the presence of 1NM-PP1 (Figure 2) are shown in pink. (B) Expression changes (log(2)) obtained from microarray experiments of the indicated HXT genes as well as STD1 and MTH1 as a function of concentration of glucose 20 min after its addition to wild-type strain Y2864 grown to mid log in SC+3% glycerol.

