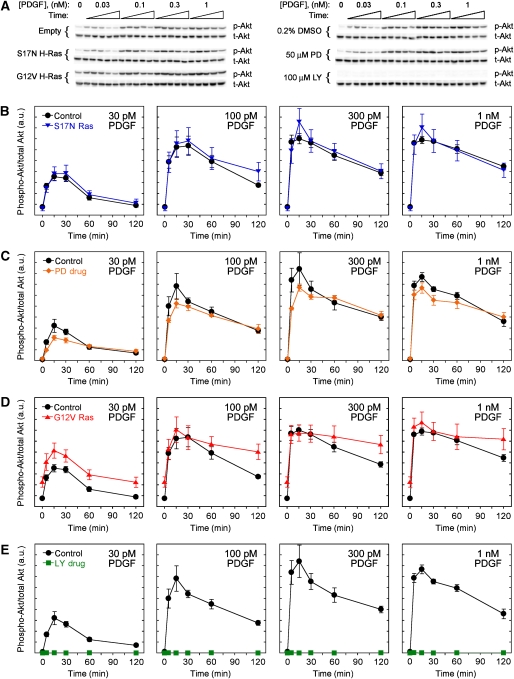
Figure 2.
Systematic analysis of PDGF-stimulated Akt phosphorylation kinetics. (A) Representative immunoblots used to quantify relative amounts of phosphorylated Akt (p-Akt) and total Akt (t-Akt) for the same set of experimental conditions as in Figure 1. (B–E) Quantification of Erk phosphorylation, normalized as described under Materials and methods, comparing either S17N Ras expression (B; n=6), MEK inhibition (C; n=5), G12V Ras expression (D; n=6), or PI3K inhibition (E; n=5) with their respective controls. Values are reported as mean±s.e.m. Source data is available for this figure at www.nature.com/msb.

