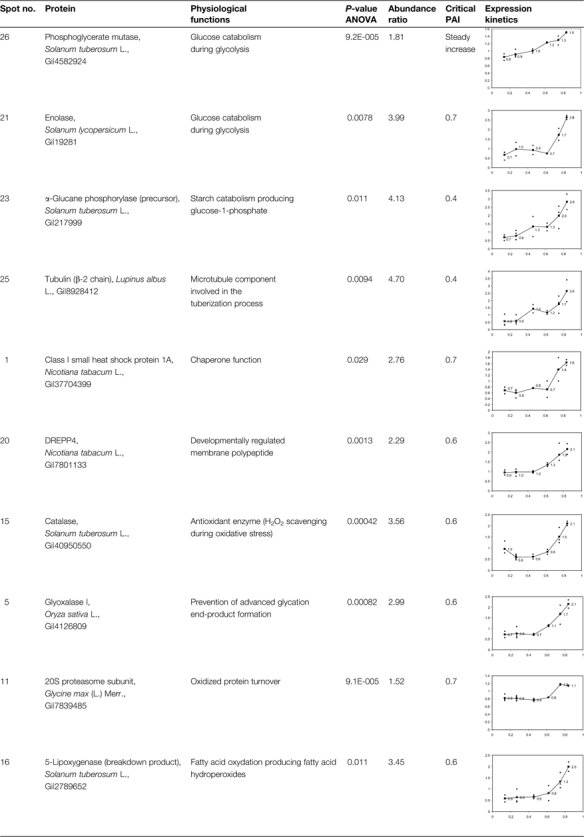
Table 2.
Abundance kinetics of up-regulated proteins during ageing
 |
The P-values corresponding to ANOVA using PAI as the fixed factor are presented as well as the ratios between extreme abundance values. Critical PAI values corresponding to the major changes are also presented in the table. Standard abundances (y-axis) as a function of PAI (y-axis) are displayed in the graphics.
