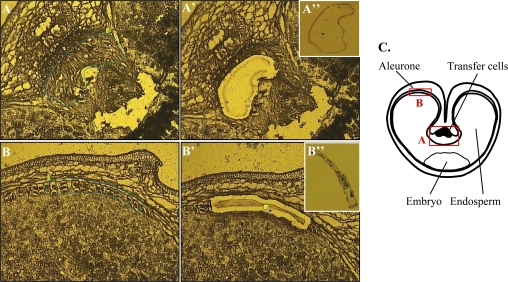
Fig. 1.
Laser capture of transfer cells (A) and aleurone cells (B). The cells of interest are marked with a line (A, B); the laser cuts along the line and catapults the isolated tissue into the lid of a tube (A′, B′); the captured tissue can be visualized in the cap (A′′, B′′). (C) Schematic drawing showing a cross-section of a cereal grain and the localization of the isolated tissues. (This figure is available in colour at JXB online.)

