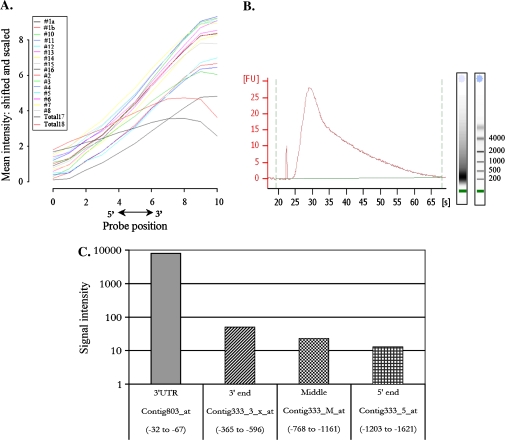
Fig. 3.
(A) RNA degradation plot showing the average signal intensity at each position from the 5′ end to the 3′ end of the probe set. The general pattern shows lower intensities towards the 5′ end. (B) Profile of biotin-labelled aRNA prior to fragmentation. The average sizes of the transcripts are 200-400 nucleotides. (C) Histogram showing signal intensities from four different probe sets located in the 5′ end (Contig333_5_at), in the middle region (Contig333_M_at), in the 3′ end (Contig333_3_x_at), and in the 3′ untranslated region (Contig803_at) of the gene encoding the tubulin alpha2-chain (TC156922) from the T_1 sample. The positions of the target sequences that comprise each probe set relative to the termination of the coding region are shown. (This figure is available in colour at JXB online.)

