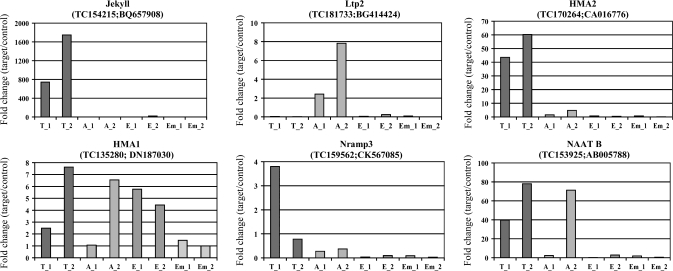
Fig. 5.
Histograms showing relative gene expression levels calculated from real-time PCR data. The experiments were performed with the same amplified materials that were used for the hybridizations. T_1 and T_2: transfer cell samples from plants 1 and 2; A_1 and A_2: aleurone samples from plants 1 and 2; E_1 and E_2: endosperm samples from plants 1 and 2; Em_1 and Em_2: embryo samples from plants 1 and 2.

