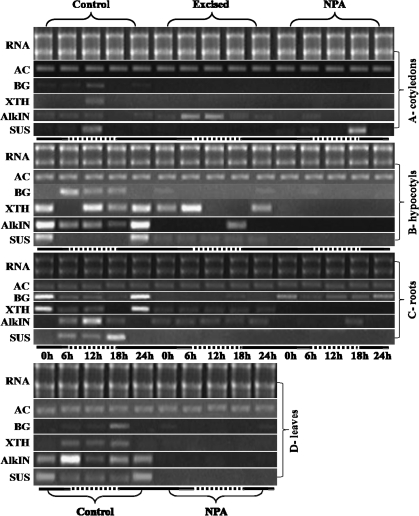
Fig. 6.
Patterns of gene expression of actin (AC), HcBGAL1 (BG), HcXTH1 (XTH), HcAlkIN1 (AlkN), and HcSUS1 (SUS) in different organs of 45-d-old seedlings of H. courbaril. Gene expression was followed using semi-quantitative RT-PCR during 24 h by sampling every 6 h. Solid white bars represent the dark periods and dashed lines the light periods during the experiment. Treatments were excision of the top shoot and inhibition of auxin polar transport by application of NPA. Densitometry was performed for each gel and essentially confirmed the patterns observed in this figure.

