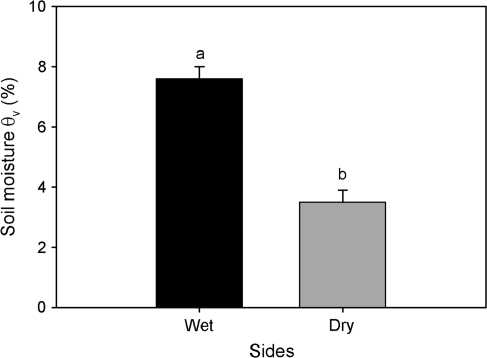
Fig. 2.
Volumetric soil moisture content (%) on the wet and dry sides of the root system measured at 20.00 h, 2 h after irrigation and right before root water potential measurements. Error bars represent one standard error of the mean (n=5), and different letters indicate a significant difference between sides of the split-pot (P < 0.05).

