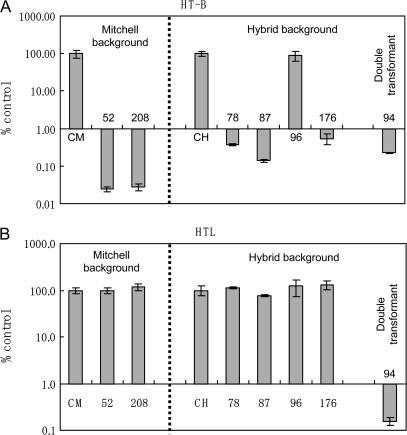
Fig. 8.
Quantitative analysis of the transcripts of HT-B and HTL in RNAi transgenic plants. Levels of transcripts for HT-B (A) and HTL (B) were determined by quantitative real-time PCR. Values from three independent experiments are expressed as a percentage of controls (±SD). CH and CM are untransformed controls of hybrid and Mitchell backgrounds, respectively.

