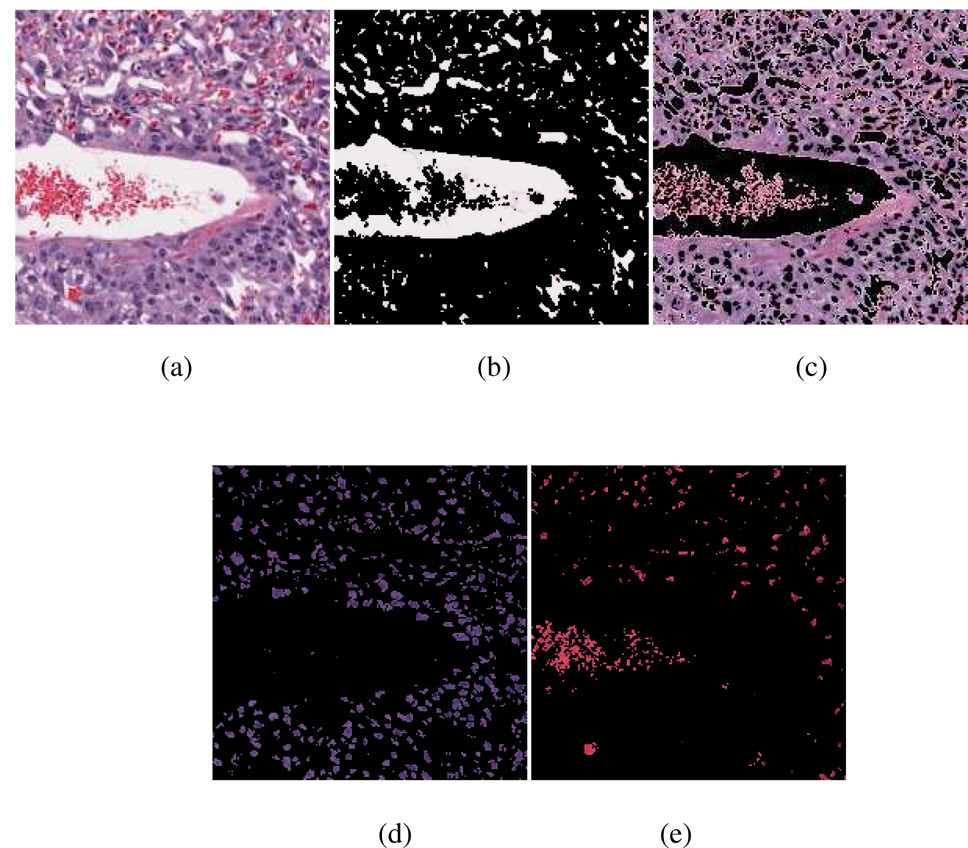
Figure 3.
An example of the color segmentation. (a): A 200-by-200 pixel patch of the original image (downsampled by four times for visualization purposes). (b): Segmented background region. Most of the white background regions correspond to blood vessels. A small fraction of them (in the bottom left corner of the image) correspond to cytoplasm regions for the large cells in the spongiotrophoblast layer. (c): Segmented cytoplasm region. (d): Segmented cell nuclei region. (e): Segmented red pixels corresponding to the remaining red blood cells in the blood vessels.

