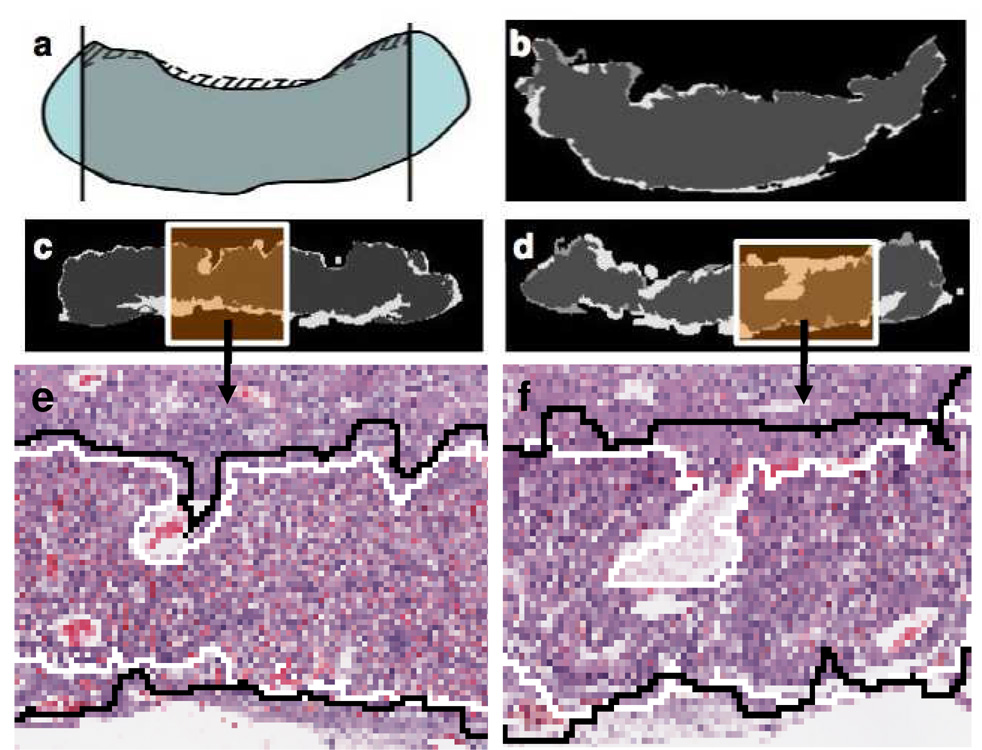
Figure 6.
Evaluation of the automatic segmentation algorithm. (a): The solid line is the manually marked boundary and the dashed line is the automatic segmentation result. The boundary estimation error is defined as the ratio between the shaded area and the grey area. (b), (c) and (d): examples of images with boundary estimation errors being 2.5%, 8.4% and 16.5%. The boundary is in the top portion of the image. The dark gray area is the manual segmentation result, and the light gray area is the automatic segmentation result. (e) and (f): a larger view of the difference between manual segmentation (black) and automatic segmentation (white).

