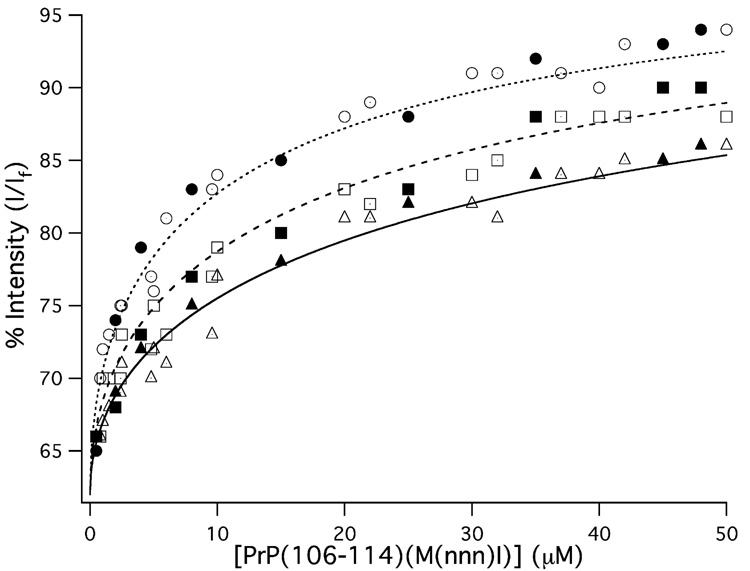
Fig. 2.
Fluorescence intensity of the 350 nm W(99) emission from PrP(91–126) as a function of PrP(106–114)(M(nnn)I) concentration. The titration data for PrP(106–114)(Cu(M112I)) are given as circles, the data for PrP(106–114)(Cu(M109I)) are given as squares, and the data for PrP(106–114)(Cu(M109/112I)) are given as triangles. The closed, open, and dotted shapes depict individual trials. The lines (dotted: PrP(106–114)(Cu(M112I)); dashed: PrP(106–114)(Cu(M109I)); solid: PrP(106–114)(Cu(M109/112I))) depict the best fits to the titration data.

