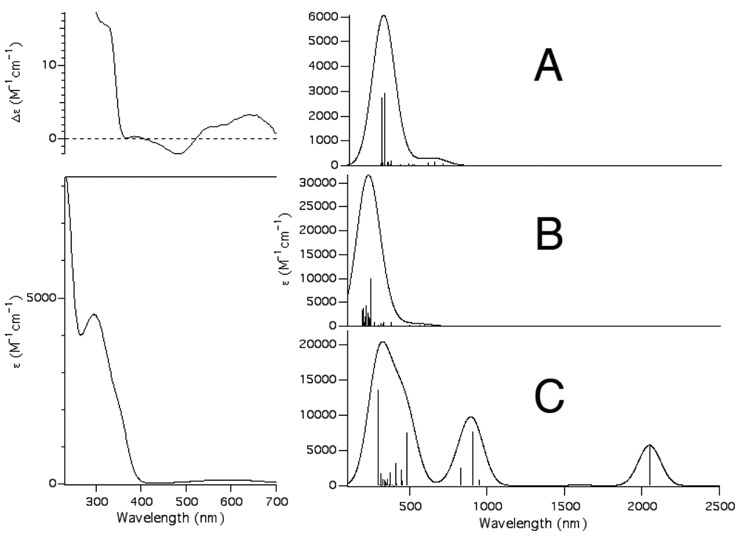
Fig. 6.
The left hand figures depict the CD spectrum (top) and electronic absorption spectrum (bottom) of {CuII(PrP(106–114))} highlighting the SMet → Cu(3d) transition. The right hand figures depict the calculated spectra for [CuII(KH)O]+ (A), [CuII(GKH)]+ (B), and [CuII(KH)N]+ (C). For the simulated spectra a line-width at half-height of 1000 cm−1 was used for all transitions.

