
Figure 8.
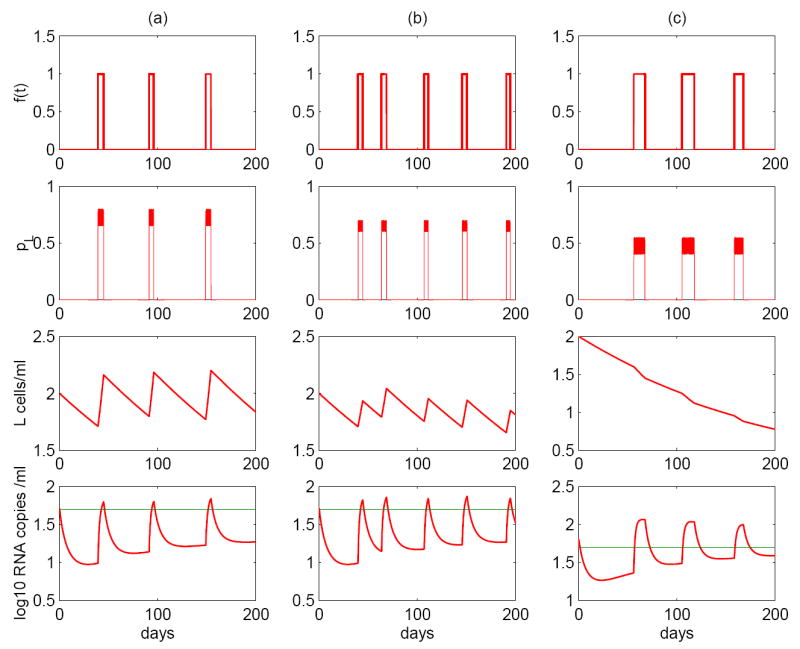
Stochastic simulations of asymmetric division of latently infected cells (model (7)). The model can robustly generate intermittent viral blips. Column (a): the interval between adjacent infections, ΔT, ~ N(50, 10); the duration each activation lasts, Δt, ~ U(4, 6); the probability pL ~ U(0.65, 0.8). Column (b): ΔT ~ N(40, 10), Δt ~ U(4, 6), pL ~ U(0.6, 0.7). Column (c): ΔT ~ N(50, 10), Δt ~ U(7, 14), pL ~ U(0.4, 0.55), viral production rate pυ = 2500 day−1. Three realizations display variable viral decay kinetics of the latent reservoir. (a) The decay rate is not statistically significantly different from zero, suggesting that the latent reservoir may not decay. (b) Although the latently infected cell pool size decreases, the decay rate is very small, corresponding to a very long half-life, for example, 44 months. (c) The latent reservoir shows a quicker decay than the scenario (b), corresponding to a shorter half-life, such as ~ 6 months. The probability that a daughter cell remains in the latent state when cells divide and the duration of each activation are two key factors controlling the decay of the latent reservoir.