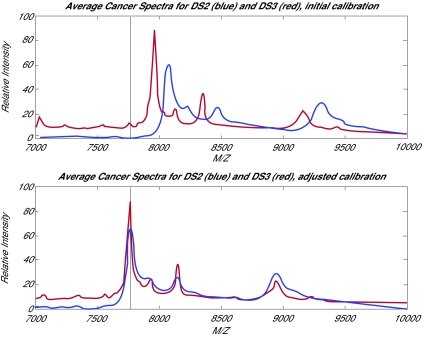
Figure 1.
(a) The average cancer spectra from DS2 and DS3, with the location of the maximum peak from Conrads et al. (2003) shown. The posted spectra appear offset. (b) The corresponding average spectra after using the labeled peaks in the Conrads et al. (2003) figure to recalibrate the spectra. Agreement between DS2 and DS3 is now good throughout the region bracketed by calibrants.

