
FIGURE 1.
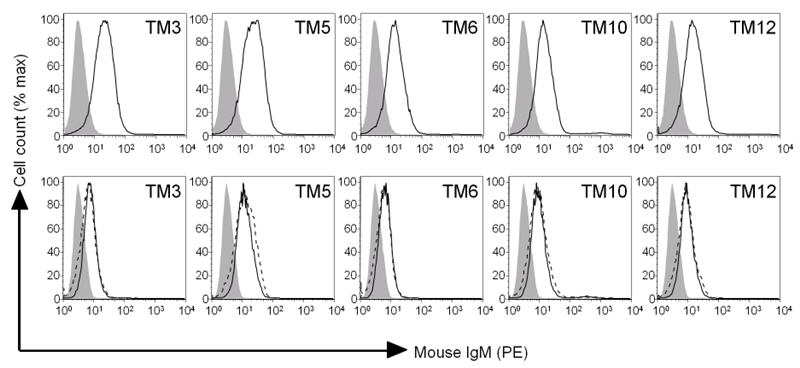
mAbs were generated from ‘protected’ mice vaccinated with 1×10⁷ irradiated B16FasL cells and which had rejected at least three subsequent challenges with 5×10⁵ B16F10 cells. Top row: B16F10 were stained with the mAbs indicated and analysed by flow cytometry. Open line - staining with mAb indicated. Bottom row: B16F10 (black line) and B16FasL (dashed line) were stained with the mAbs indicated. In all figures, closed line = isotype control staining of B16F10.