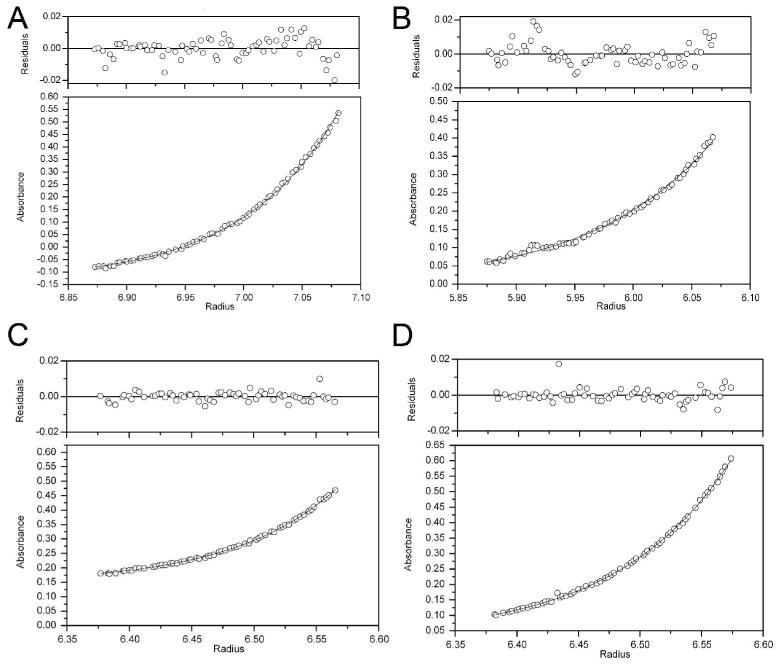
Figure 3.
Sedimentation equilibrium ultracentrifugation of DJ-1 and PD-associated mutants. Each panel represents the measured absorbance at 277 nm as a function of radius (lower plots), and the residuals after fitting to a dimeric model for each sample (upper plots) after sedimentation equilibrium ultracentrifugation. The best-fit curve is shown as a solid line in the lower plots for each sample. Shown in panel A is wtDJ-1, panel B is A104T, panel C is E163K and panel D is M26I. Representative data for an experiment conducted at 2×10⁴ rpm and 25°C is shown. Other self-association models resulted in no improvement in the residuals and thus the simple dimer model was retained.

