Figure 10.
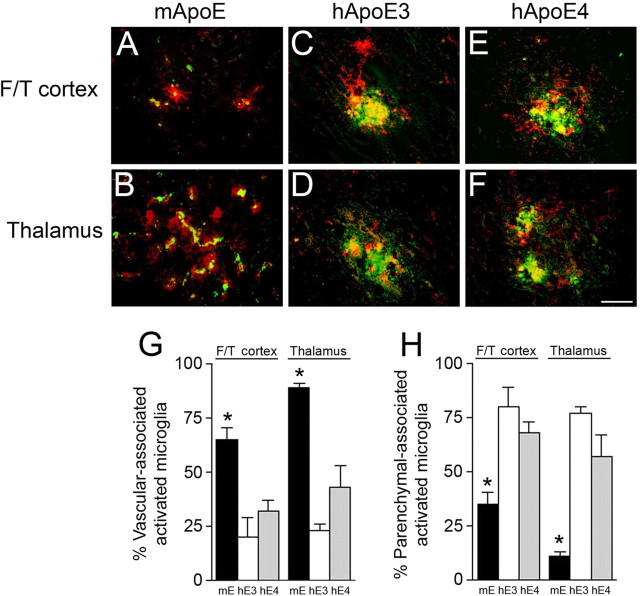
Human ApoE3 and ApoE4 shift activated microglia from the cerebral microvasculature to parenchymal fibrillar plaques. Brain sections from 12-month-old mice were labeled with thioflavin-S to identify fibrillar amyloid (green) and monoclonal antibody 5D4 to keratan sulfate to reveal activated microglia (red). A–F, Tg-SwDI/muAPOE mouse cortex (A) and thalamus (B); Tg-SwDI/hAPOE3/3 mouse cortex (C) and thalamus (D); Tg-SwDI/hAPOE4/4 mouse cortex (E) and thalamus (F). Scale bar, 50 μm. G, H, Quantitative stereological estimation of the percentage of microvascular fibrillar amyloid-associated (G) or parenchymal plaque fibrillar amyloid-associated (H) activated microglia. Tg-SwDI/muAPOE mice (black bars) show a strong microvascular amyloid association, whereas Tg-SwDI/hAPOE3/3 mice (white bars) and Tg-SwDI/hAPOE4/4 mice (gray bars) exhibit a robust parenchymal amyloid association. The data presented are the mean ± SD (n = 8 animals per group). In the cortex and thalamus, Tg-SwDI/muAPOE mice had higher numbers of vascular-associated microglia and lower numbers of parenchymal-associated microglia compared with Tg-SwDI/hAPOE3/3 mice or Tg-SwDI/hAPOE4/4 mice (*p < 0.01). F/T, Frontotemporal cortex.

